

The Job Dashboard displays the most relevant information pertaining to a job during and after the job has run. There are several distinct types of information that are displayed on this dashboard and they are outlined in this article.
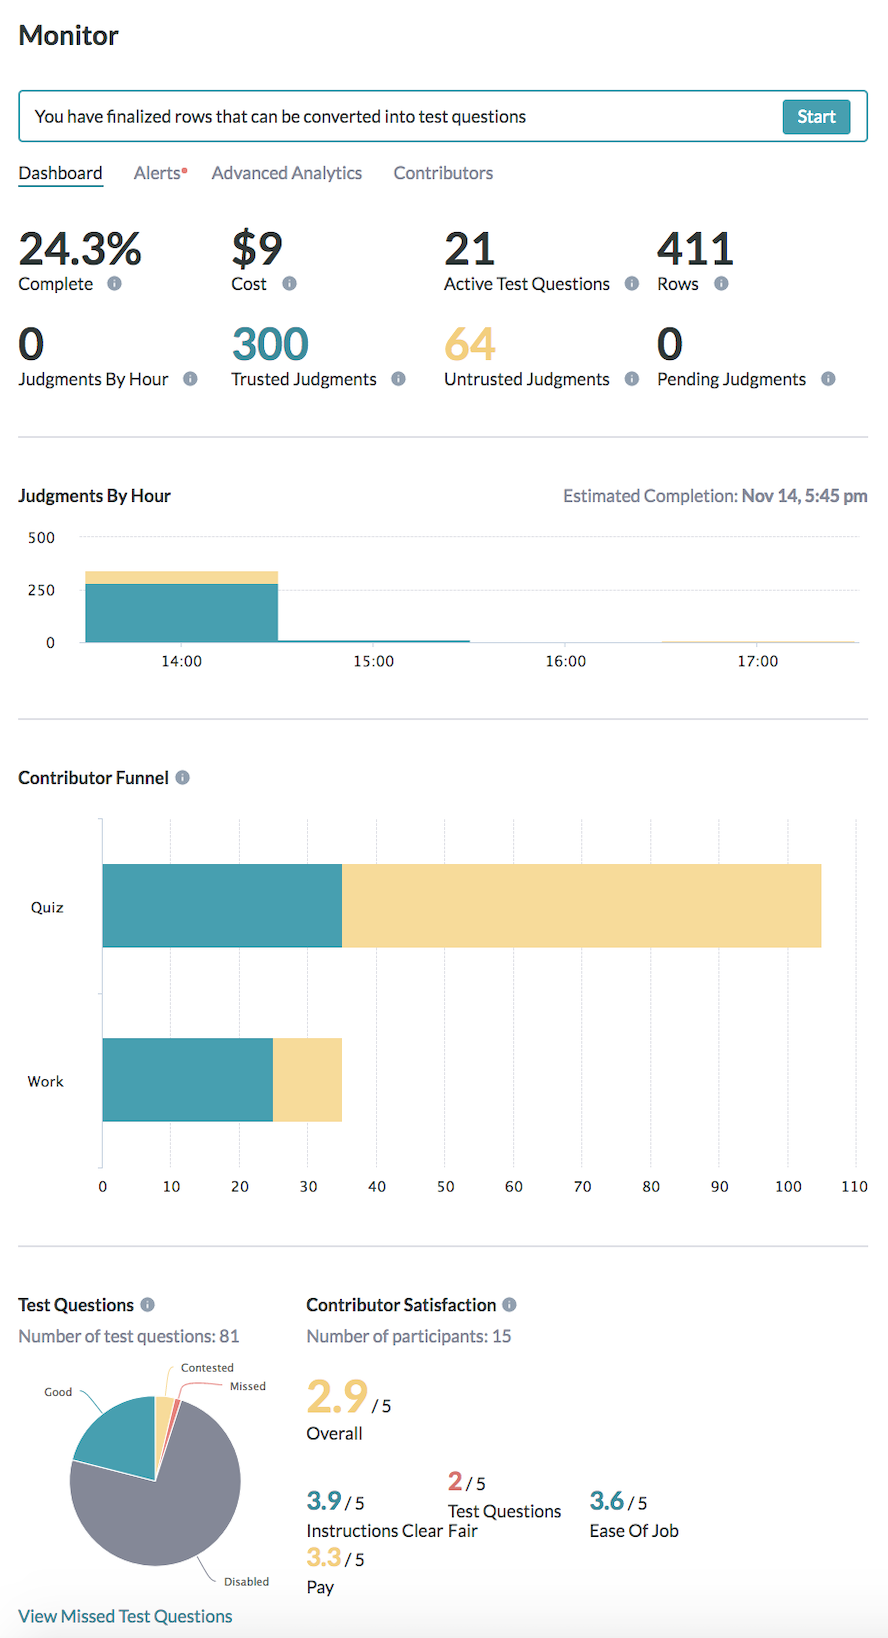
Fig. 1: Job Dashboard
Complete
Displays the percentage of finalized units in a job.
Cost
Displays the current cost of a job.
Active Test Questions
Displays the total number of Test Questions in a job.
Rows
Displays the total number of units in a job. This count does not include Test Questions. This will display one unit for survey jobs.
Note: Hover over the unit count to see how many units there are in total, how many have been launched and how many are new units.
Judgments Per Hour
Displays the average number of judgments collected per hour submitted over the last 24 hours.
Trusted Judgments
This displays the total number of Trusted Judgments a job has collected. This count does not include judgments on Test Questions.
Untrusted Judgments
This displays the total number of Untrusted Judgments a job has collected. This count does not include judgments on Test Questions.
Pending Judgments
This displays the number of judgments that have been sent to and are awaiting judgment by the crowd. These judgments are likely currently being worked on or will be worked on in the near term.
Judgments Per Hour Graph
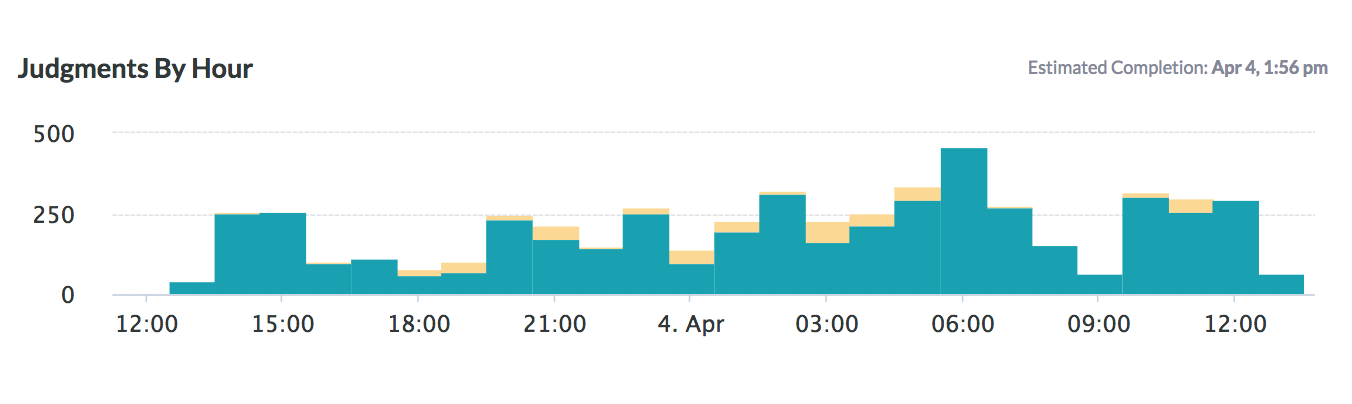
Fig. 2: Judgments Per Hour Graph
This graph displays the throughput of judgments over time. The vertical axis of this graph shows the amount of judgments and the x axis shows the time of the judgments. Trusted judgments are shown in green and untrusted judgments are shown in red.
Note: Hover over a section of the graph to see the total judgments counts in that time period.
Estimated Completion
Directly above the Judgments Per Hour Graph, the job dashboard shows the estimated completion time. This shows the date and time that a job is expected to finish.
Contributor Funnel
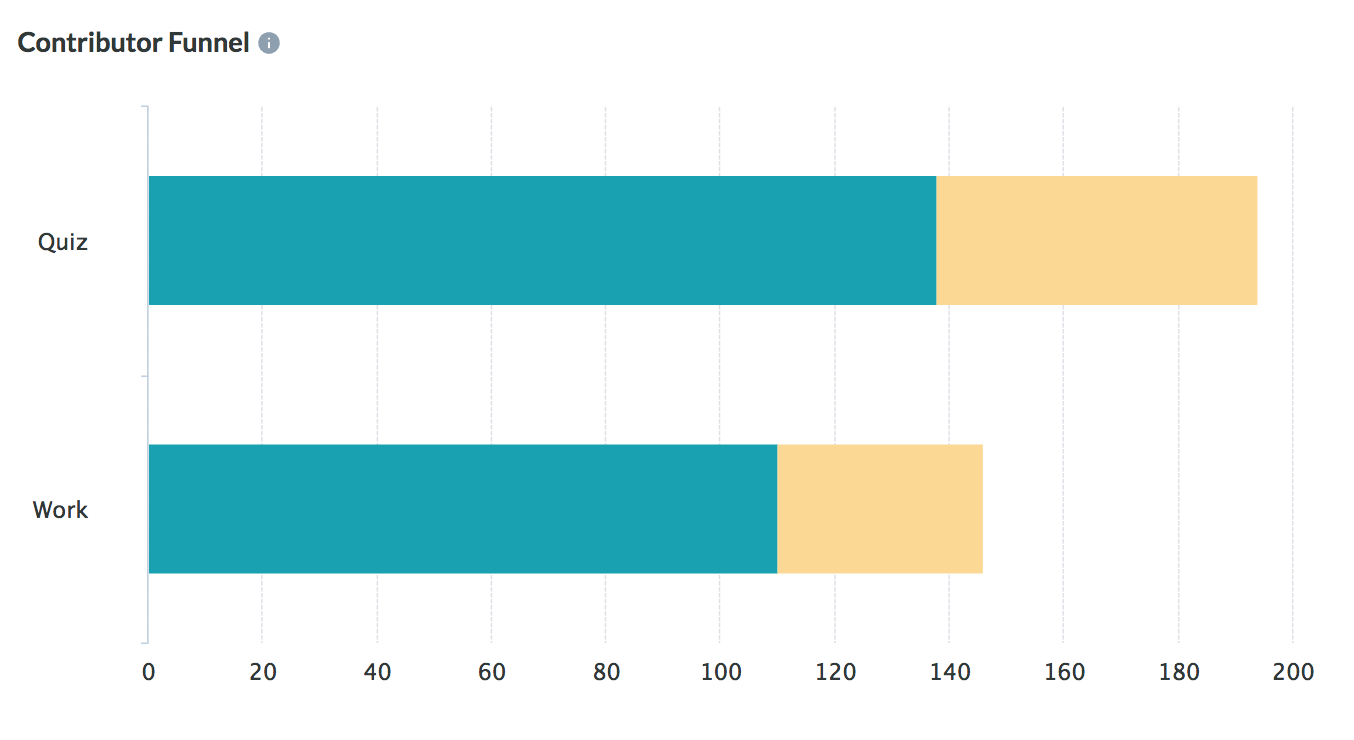
Fig. 3: Contributor Funnel
Quiz
This bar shows contributor performance on Quiz Mode in a job.
- Contributors that pass Quiz Mode are shown in green.
- Contributors that fail Quiz Mode are shown in yellow.
Work
This bar shows contributor performance on Work Mode in a job. Contributors must pass Quiz Mode to enter Work Mode and submit judgments on new units.
- Trusted contributors are shown in green.
- Contributors that fail Work Mode are shown in yellow. Contributors fail Work Mode by answering Test Questions incorrectly in tasks so that they fall below the Accuracy Threshold of a job.
- Contributors that are flagged in a job are shown in yellow.
Note: Hover over the graph to see the exact number of contributors for each color denomination.
Test Questions
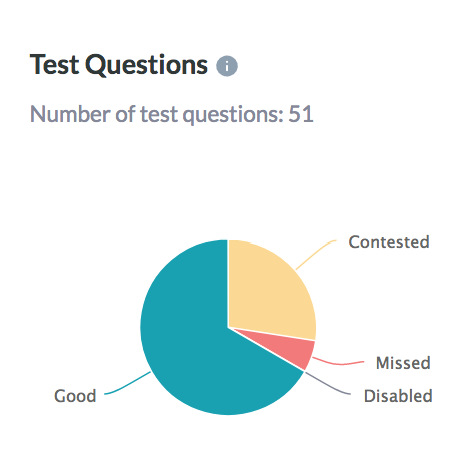
Fig. 4: Test Question Pie Chart
This is a pie chart that shows contributor performance on Test Questions in a job. The chart shows Test Questions that are:
Good
Test Questions are considered “good” when the majority of judgments have been correct.
Contested
The Contested segment represents Test Questions that have been missed more than 50% and contested more than 20% of the time.
Missed
The Missed segment represents Test Questions that have been missed more than 50% of the time.
Disabled
The disabled Test Questions are Test Questions that have been manually disabled in a job.
Total
Displays the total amount of Test Questions in a job.
View Missed Test Questions
Click this link to open a page of the missed Test Questions in a job.
Contributor Satisfaction
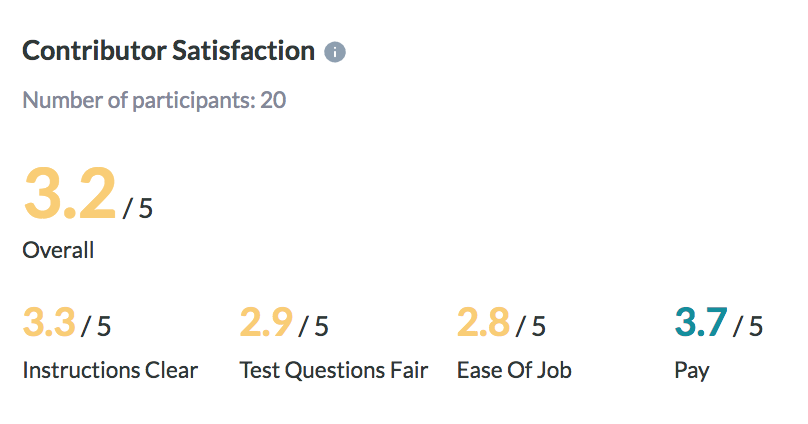
Fig. 5: Contributor Satisfaction
Upon completion of a task, contributors are prompted to take a satisfaction survey. This allows a job owner to receive feedback about a job from contributors. The score is given on a 0-5 scale.
Overall
This is the score that contributors give a job in general.
Instructions Clear
This is a score of how clear contributors find instructions of a job.
Test Questions Fair
This shows the fairness of Test Questions in a job.
Ease Of Job
This shows how easy contributors find a job.
Pay
This shows how satisfied contributors are with the payment of a job.
Participants
Displays how many contributors have participated in the satisfaction survey.
Tip: Revisit each aspect of a job that contributors score low. This is a great indicator of what improvements should be made to a job.